Taking footfall data to the rent negotiation
Rent negotiation with footfall data: how 12-month entry trends, corridor traffic and visit rate turn into a concrete argument with mall management.
Taking data to a rent negotiation means showing, with measured figures, how many visitors your store’s location actually brings. A 12-month visitor trend lets you say “we measured it” instead of “we feel it” in rent negotiations with mall management or a landlord. In this post we cover which data helps, how to prepare your file and the most common mistakes.
Why data?
Rent negotiations often run on each side’s impressions. Mall management highlights total footfall for the building; the store feels its own floor or corridor is quieter. Entry data measured at the store door puts the discussion on solid ground: how many visitors does the location bring your store, and how is that number changing year on year? Measured data turns the negotiation from competing claims into a conversation in which both sides look at the same table.
Which report?
In the Sayiyo visitor analytics dashboard you see each store’s monthly average, trend, year-over-year comparison and (with sales integration) conversion rate, and export the data to Excel/CSV. For a negotiation file, these views are usually enough:
- Monthly average entries and trend over the last 12 months
- Comparison with the same period last year
- Hourly entry curves for weekdays and weekends
- Monthly conversion rate, if you have sales integration
- Passers-by and visit rate, if storefront traffic is measured
Location traffic: passing by and coming in
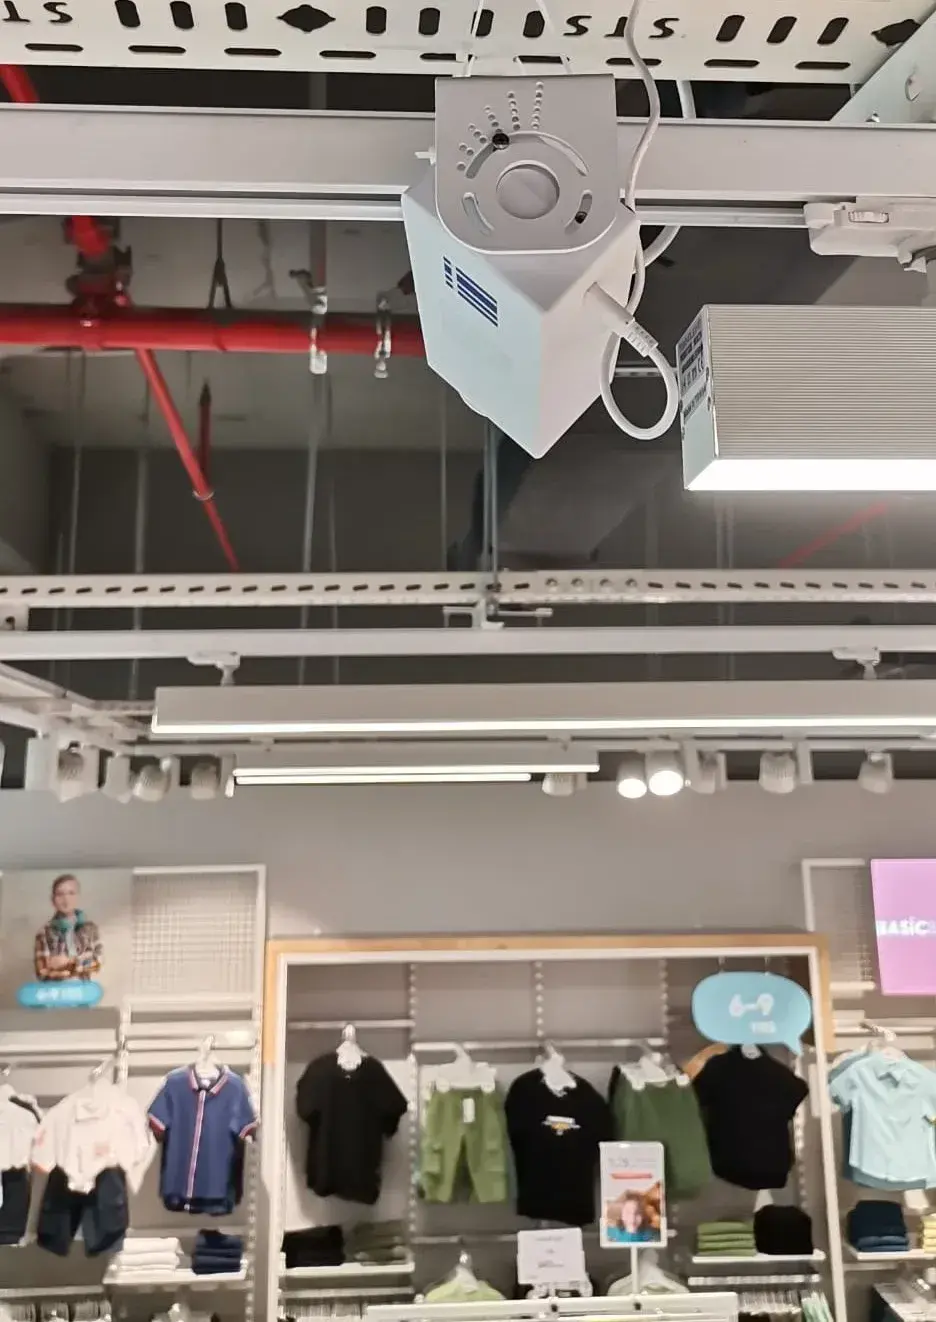
Entries show the visitors your store draws; to see a location’s potential, you also need to know how many people pass by. The Sayiyo PASS storefront counter counts passers-by with a radar sensor aimed at your window; together with the Sayiyo PEOPLE people counter it gives you the visit rate. This distinction matters at the table: if corridor traffic is low, the location itself is in question; if traffic is high but visit rate is low, the window and entrance need work first.
How to prepare
- Start counting at least a few months before the negotiation; ideally build up 12 months of data.
- Export the data from the dashboard as Excel/CSV and turn it into a monthly table.
- Compare with the chain’s branches in other malls; the dashboard’s store comparison and ranking are built for this.
- Note unusual periods such as campaigns, refurbishment or changes inside the mall.
- Tie the figures to a single conclusion: how has traffic changed, and what does that mean for this location?
Reading rent alongside traffic
Relating the rent to traffic, rather than discussing it on its own, strengthens your position. Divide the monthly rent by that month’s entries to get the rent burden per visitor, then compare it across branches and year on year. If entries fall while the rent burden rises, that is concrete support at the table; if entries rise, you see the location’s value in your own data.
A simple structure for the negotiation file: a one-page summary (main finding and request), a monthly entries table, a year-on-year comparison chart, hourly curves for weekdays and weekends, visit and conversion rates where available, and finally notes on unusual periods.
Common mistakes
- Relying on a single month: seasonality distorts the picture.
- Missing entrances: if a second door is not counted, entries look low and the argument weakens.
- Mixing up the mall’s total footfall with store data: they answer different questions.
- Overstating the figures: presenting the data as it is builds trust.
A common language with mall management
Data helps beyond the negotiation, in day-to-day work with mall management. You can jointly track how corridor layout, wayfinding signs or events affect store entries. We cover mall-specific measurement in our guide to shopping mall footfall counting.
The same data is useful beyond contract renewals. When assessing a location for a new branch, entries, visit rate and conversion data from your existing branches give you a basis for what to expect from a store in a similar location. In closure or relocation decisions, it helps you argue from the annual trend rather than from one bad season.
Frequently asked questions
How much data do I need for a rent negotiation?
12 months of data is the strongest basis because it shows seasonality. You can start with a shorter period, but factor seasonal effects into your reading. Rather than starting to count close to the end of the lease, making measurement a permanent habit strengthens your hand at every renewal.
Do I have to measure storefront traffic?
No; entry data alone is strong support. But if you also measure corridor or street traffic, you can tell whether low entries stem from the location or from the window.
Can I share the data with mall management?
Yes. You can export the data from the dashboard as Excel/CSV and share it. Counting data is anonymous and aggregate; it contains no information about individuals. You decide what to share, for example only the monthly summary table.
Why does conversion rate matter in the negotiation?
Entries show the traffic; conversion rate shows how much of that traffic turns into sales. With sales integration, the dashboard calculates conversion rate automatically; for the calculation, see how to calculate store conversion rate.