How to manage peak hours in a mall store
How to manage mall peak hours: track hourly entries with data refreshed about every 10 minutes, and plan staffing and customer experience in good time.
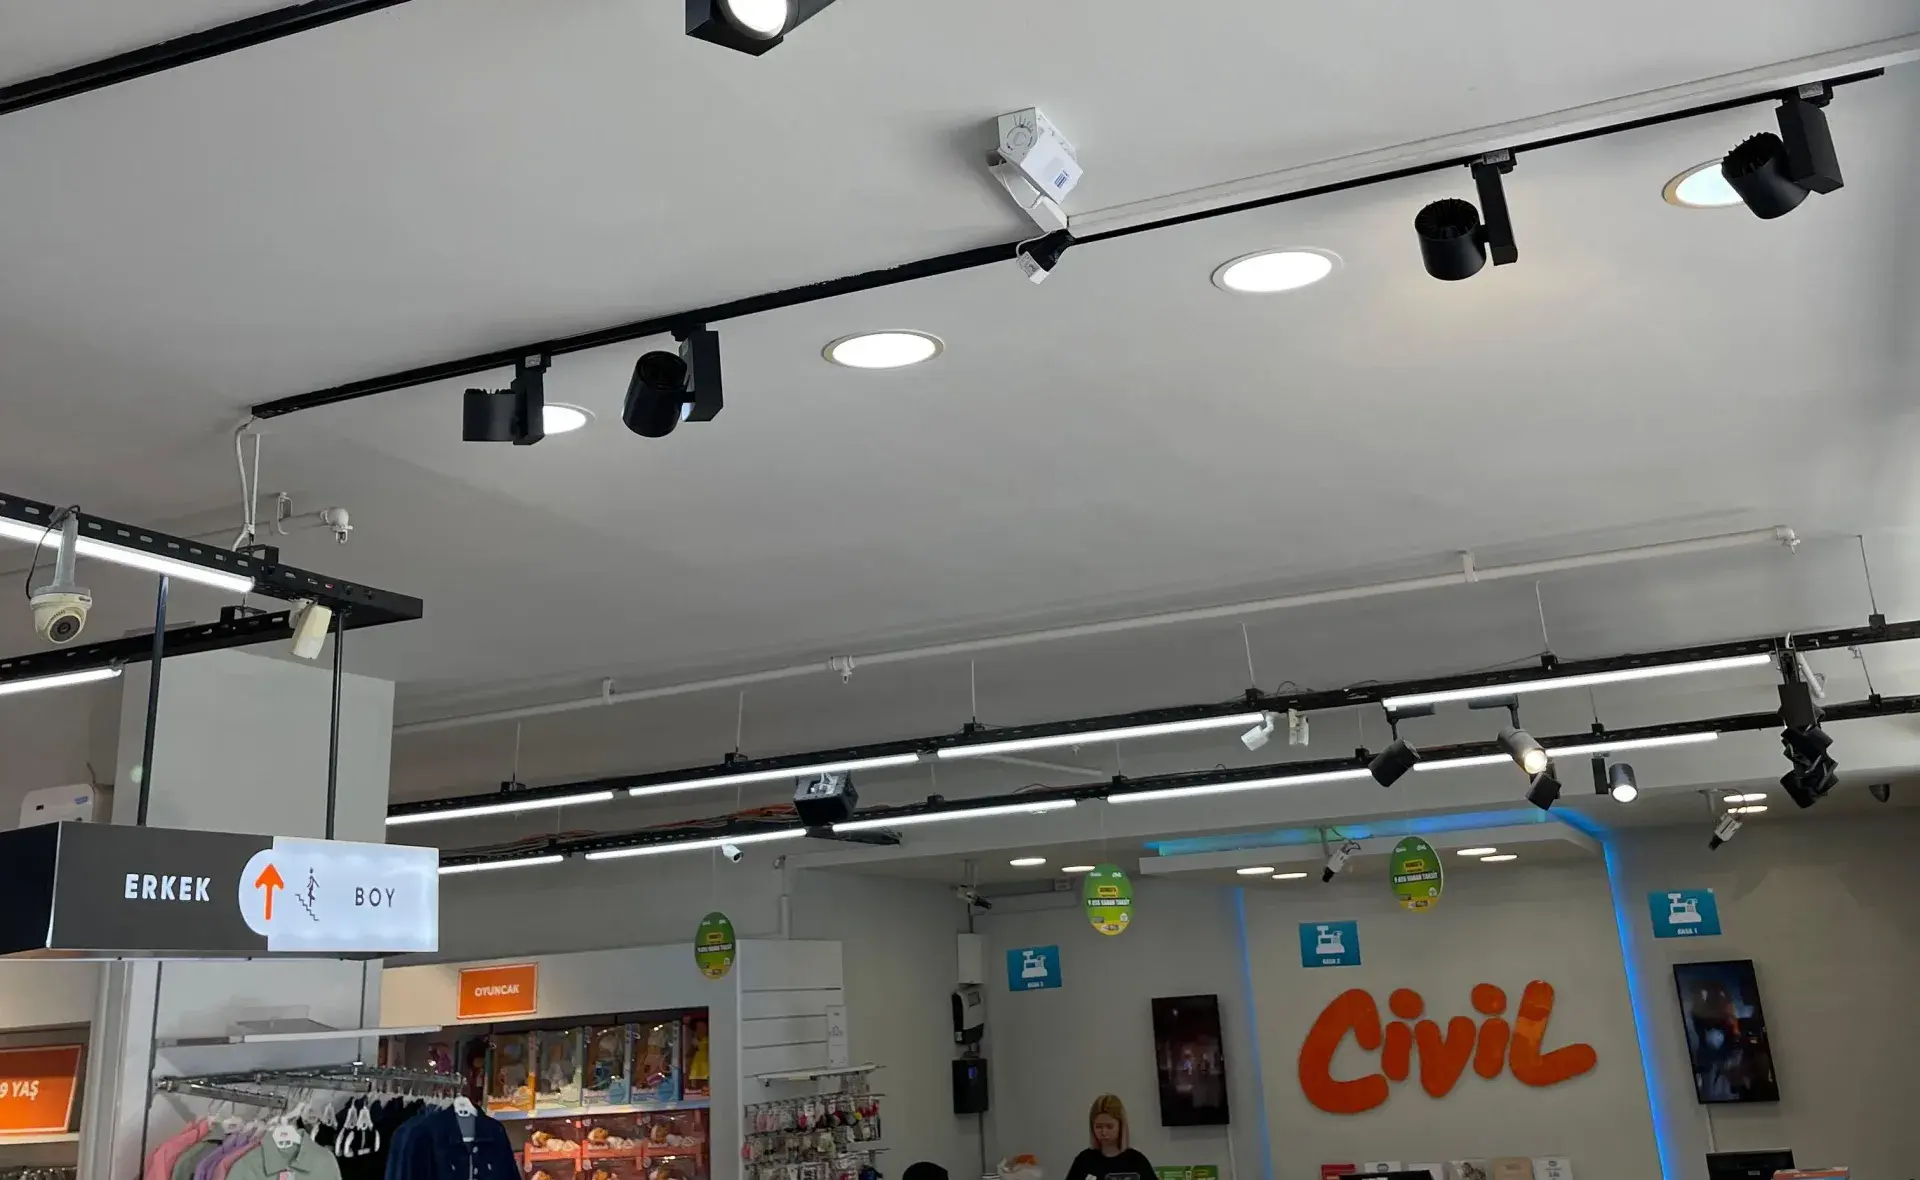
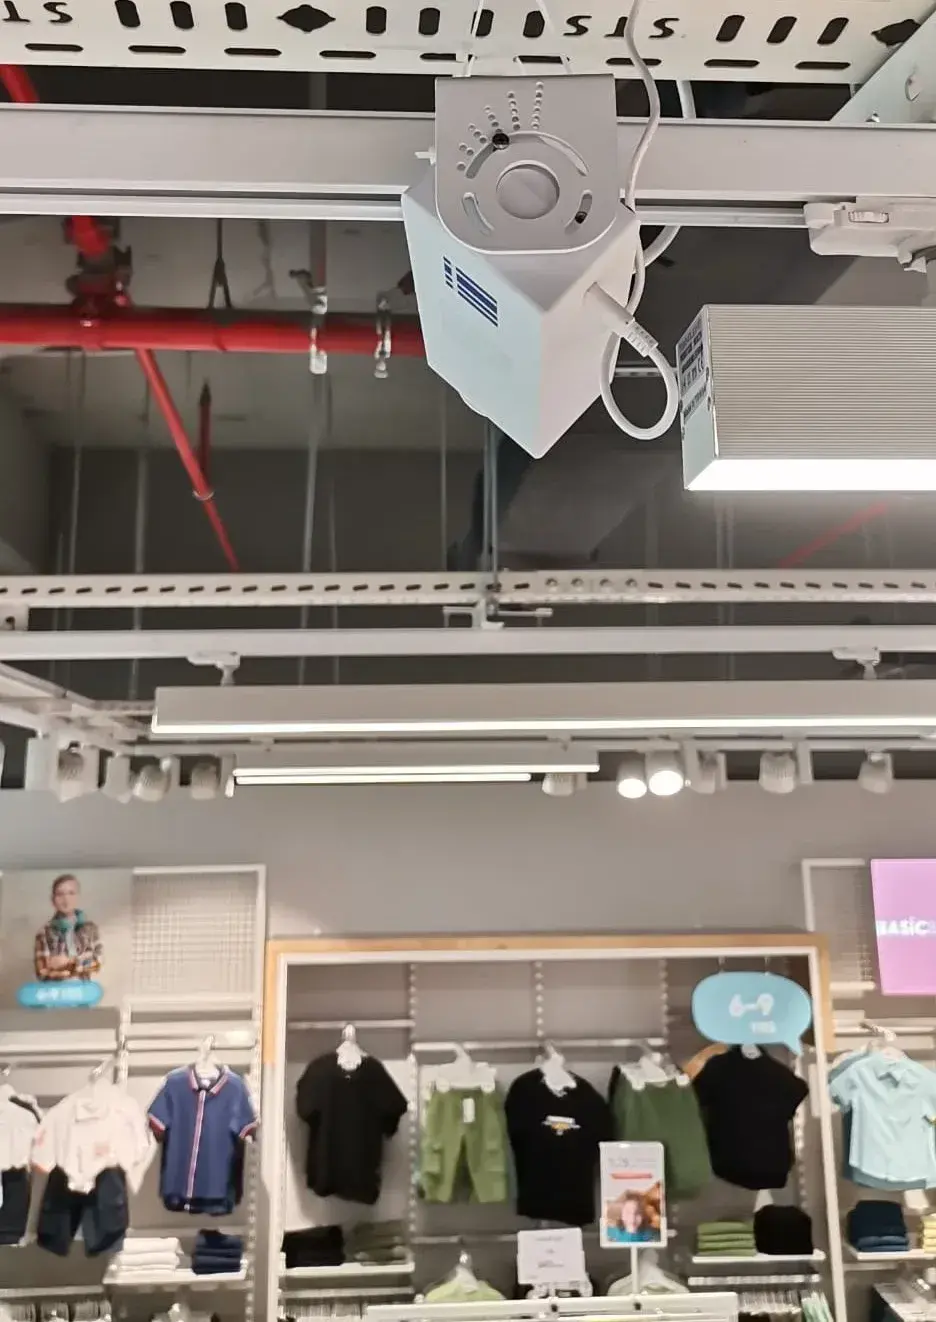
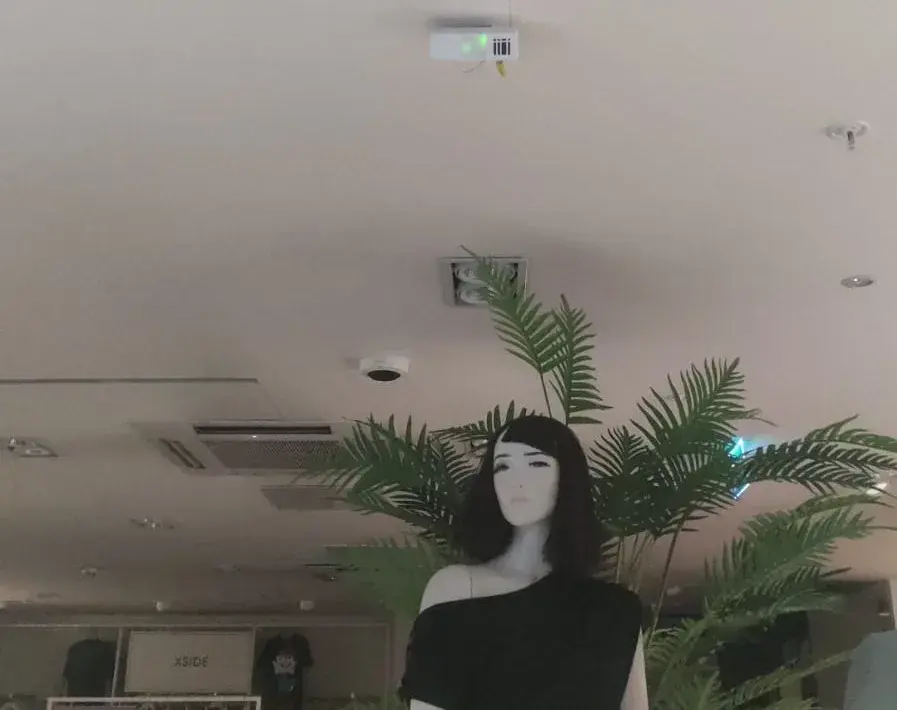
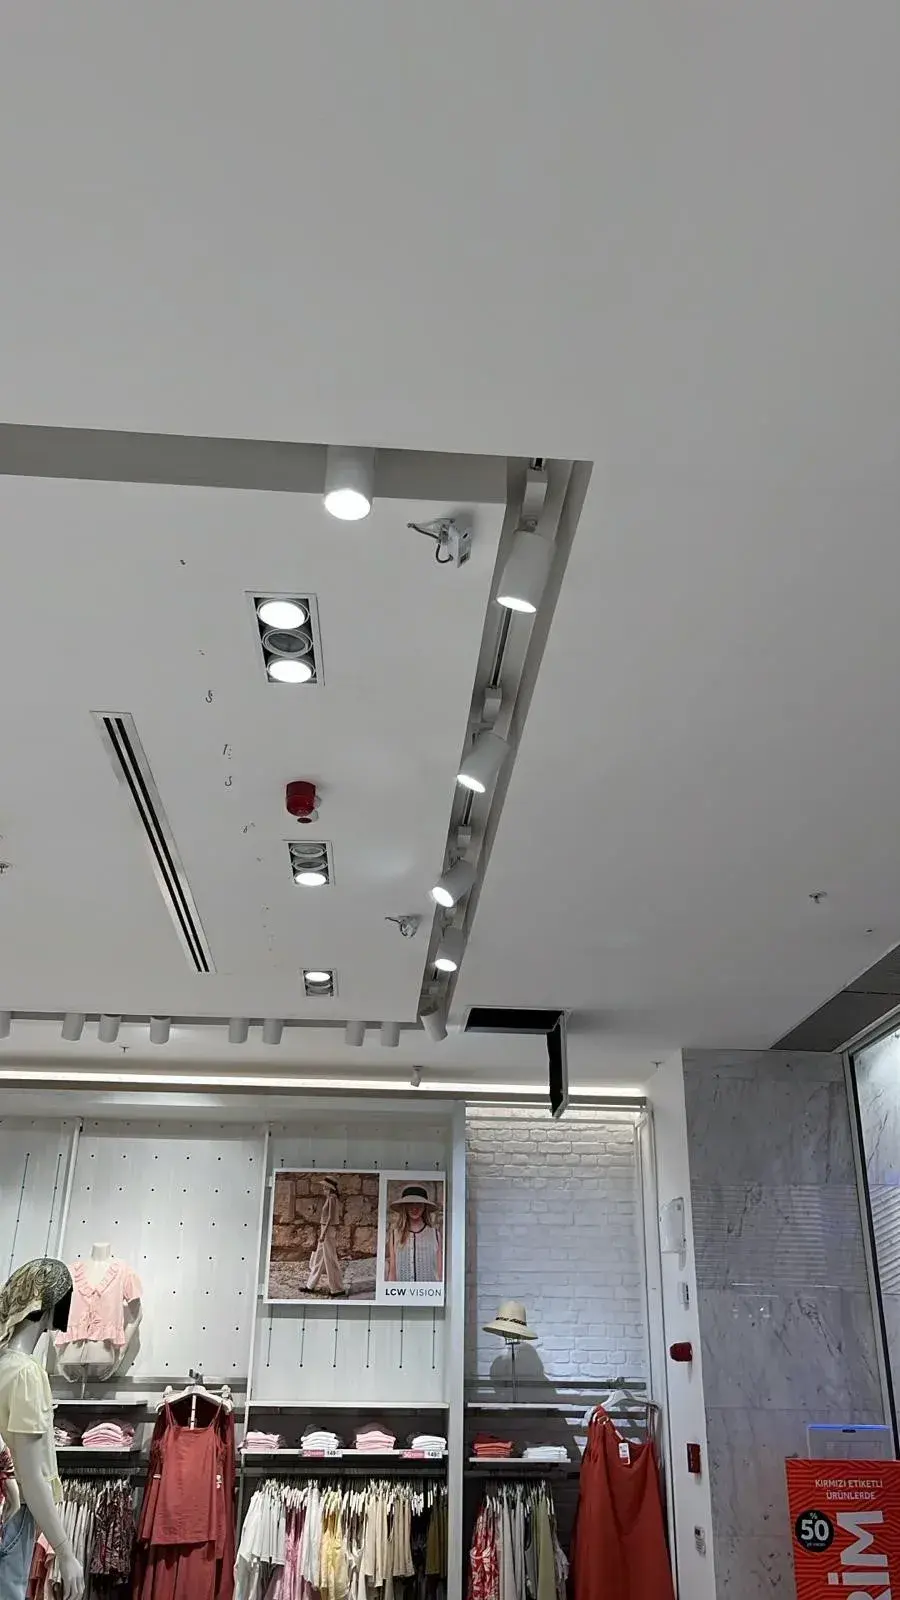
Managing mall peak hours starts with knowing how many people come into your store through each door, hour by hour. The short answer: fit a people counter at every entrance, watch the hourly entry curve for a few weeks, identify the peak hours and build your staffing plan around them. The Sayiyo PEOPLE people counter counts people entering, anonymously, with an AI camera above the door; images are processed on the device and not recorded.
What is a peak hour?
A peak hour is a time slot in which entries to your store rise clearly above the daily average. An illustrative example: in a store averaging 40 entries an hour across the day, the hours that see 70–80 entries are peak hours. What is measured here is not how many people are inside at a given moment, but how many come through the door in a given hour. Sayiyo does not count exits or show live occupancy; you read peak hours from the entry curve.
How often is the data updated?
Counts reach the Sayiyo dashboard in periods of about 10 minutes. It is not second-by-second crowd control; it shows the entry curve through the day and the peak hours in good time. If the internet drops, the device keeps counting, stores data for up to 20 days and sends it once the connection is back.
Reading the entry curve in a mall
In mall stores the curve can look different from high-street stores. When you read it, ask:
- Which hours peak, and do lunchtime and evenings stand out?
- How far does the weekend curve differ from weekdays?
- How do school holidays, campaigns and special days change the curve?
- Do the chain’s branches in different malls peak at the same hours?
Identifying peak hours, step by step
- Once every entrance is being counted, collect at least four weeks of data.
- Work out average entries for every day and hour; the dashboard’s hourly entries and peak-hours views are built for this.
- Mark the time slots that stay clearly above the average as peak hours.
- Assess special periods such as campaigns, public holidays and school breaks in a separate table.
- Review the list monthly; a new store opening in the mall or a change in corridor layout can shift the curve.
Planning around peak hours
In the Sayiyo visitor analytics dashboard you see hourly entries and peak hours for each store or area; you can schedule reports in the dashboard and receive them by email. Build your staffing plan around those hours.
- Count every entrance with its own device; the main door is not enough.
- Compare branches and areas in the dashboard to find the busiest points.
- Watch the busiest hours in a weekly scheduled report you set up in the dashboard, and plan shifts around them.
- Have store managers follow today’s entries in Sayiyo Mobile; you can get rule-based alerts when hourly entries cross a threshold you set.
Comparing data with intuition is useful too. The slot the store team thinks of as “the busiest hour” does not always match the peak on the curve; a queue at the till shows when sales peak, not entries. We share the experience of a team that rebuilt its shifts around the entry curve in planning shifts around footfall.
Preparing the store for peak hours
- Have tills and checkout staff ready before the peak.
- Move restocking from the stockroom to quieter hours.
- Add support at points that create waiting, such as fitting rooms and help desks, during peak hours.
- Schedule internal tasks such as training, stock counts and deliveries for hours when the entry curve is low.
- Keep breaks out of peak hours.
Sharing the peak-hour list with the store team makes the plan easier to put into practice. Send the weekly scheduled report to the store manager as well, so the team prepares for the same hours from the same data.
Peak hours and conversion rate
A peak hour is neither good nor bad in itself. Once sales data reaches Sayiyo through POS/ERP integration, you also see conversion rate during peak hours. If entries rise while conversion falls, there may not be enough staff or till capacity to serve visitors. If you have branches in several malls, compare stores over the same time slots in the dashboard to see which branch struggles most at peak hours.
Frequently asked questions
Does Sayiyo show how many people are inside a mall store?
No. Sayiyo PEOPLE counts entries only; it does not count exits or measure live occupancy or capacity. You read peak hours from the hourly entry curve.
How much data do I need to identify peak hours?
A few weeks of data is a good start for a reliable average by day and hour. Treat special days and campaign weeks separately and update the list as the seasons change. As data for the same period last year builds up, comparisons get easier.
How do I receive reports?
You create scheduled reports yourself in the dashboard, and they arrive by email. You can also export the data to Excel/CSV.
Can I also measure corridor traffic in the mall?
Yes. The Sayiyo PASS storefront counter counts corridor passers-by with a radar sensor aimed at your window; together with PEOPLE it gives the visit rate. See our guide to shopping mall footfall counting.